AWS Messaging & Targeting Blog
Debugging SMTP Conversations Part 3: Analyzing TCP Packets
We’ve finally reached the conclusion of our deep dive into how you can capture SMTP conversations should you need to debug an issue that lies deeper than your application. Now that we’ve gone over SMTP conversation basics and getting the easiest to decipher bits of a TCP conversation with TCP Flow, let’s look at all the information contained in a TCP conversation using TCP Dump and Wireshark.
Using TCP Dump
TCP Dump is an open source network packet analyzer (licensed under a 3-clause BSD license) which, in conjunction with the libpcap library, can also be used for capturing network traffic. It is one of the most widely used packet analyzers around because it provides a raw level of detail that solutions like TCP Flow don’t provide. It’s essentially a fire hose of data, so it’s sometimes used to capture data that is then read in using Wireshark, which is licensed under GNU GPL v2 and provides you with a great GUI for filtering and analyzing packets.
Amazon EC2 instances running an Amazon Linux AMI come with TCP Dump (tcpdump) pre-installed, so you don’t need to do anything there. The TCP Dump manual is even more intimidating than the TCP Flow manual, so here’s a simple base command you can start and experiment with:
sudo tcpdump -i any -w ~/captures/capture_%Y-%m-%d-%H-%M-%S.cap -G 30 -n -X -Z $USER “port 25”
- The -i option specifies what network interface to listen on, just as in TCP Flow. For most folks, “any” is going to work just fine.
- The -w option writes the raw packets to the file instead of printing to the console, and it’s followed by the file path and format. You can specify the time in plain old strftime format – in this example a file would look like ~/captures/capture_2014-04-30-19-15-00.cap for the time 2014-04-30T19:15:00Z if your machine’s time zone is UTC.
- The -G option is very useful if your application processes large amounts of data – it lets you specify, in seconds, how often the dump file is rotated. In this case, it’ll create a new capture file every 30 seconds (and the file naming will follow what you specified in the -w option).
- The -n option will forego printing FQDNs of host names referenced in the dump. If your application logs print IP addresses instead of host names, this option will make your life much easier.
- The -X option will print each packet in hex and ASCII, which may come in handy in Wireshark.
- The -Z option drops privileges to the user name specified, which means that you’ll own the captures instead of root owning them.
- The end of the command line is, once again, a filtering expression as defined in the pcap filter manual.
A TCP Dump and Wireshark Example: START TLS
Unlike TCP Flow output, your TCP Dump capture file(s) will probably be very hard to read. This is where Wireshark comes in handy. Wireshark actually comes with the command-line tool tshark, which you could use instead of TCP Dump (it’s built on top of TCP Dump), but it doesn’t provide a lot of added value for the general use case. If your own computer is Linux, you should be able to just install Wireshark with yum:
sudo yum -y install wireshark wireshark-gnome
There are Windows and OS X installers available from the Wireshark website, which also has detailed documentation on the suite of features that you can take advantage of. There’s a lot of documentation there, so before you browse that it’s not a bad idea to play with the program a bit to get your feet wet.
Once you have Wireshark installed, transfer your TCP Dump capture from your EC2 instance to your own computer, fire up Wireshark, and open your TCP Dump capture. On Linux, you can simply pass the capture file to Wireshark as a command-line argument (you may or may not need sudo privileges to run it):
sudo wireshark ~/capture_2014-04-16-23-52-29.cap
I recommend immediately going to “View” -> “Time Display Format” and then changing the date format from epoch time (the default) to something more readable. You’ll see a table in the center pane of the GUI that displays one row per packet of data, followed by deeper details of a selected packet, followed by a pane with a hex and ASCII view of the packet. Above all this, you’ll see a blank field that you can fill in with a filter expression, of which Wireshark has an impressive array. You can explore them with the “+ Expression” button (you should see some familiar filters under the “TCP” section from the TCP Flow filter expressions) and then choose one to slice your traffic to just what you’re interested in. There are also some default filter expressions to choose from in “Analyze” -> “Display Filters”. Let’s once again take a look at a STARTTLS conversation with Amazon SES:

There are a few items of note here:
- Everything is color coded as ingress (light blue) or egress (black). You also see grey for the ACK packet. Speaking of which…
- Notice that you can see where the connection was established with the SMTP server – the first three packets. The first packet is the SYN packet from the SMTP client to the SMTP server to open a TCP connection. The second packet is the SYN ACK from the server to the client that it received the SYN packet. The third packet is the ACK from the client to the server that it received the SYN ACK and the connection is established. This is especially useful if you’re trying to determine if there are high latencies during connection establishment or between when the connection is established and receiving the SMTP greeting (the fourth packet) or latencies between all that and when your client starts sending an EHLO, etc.
- In the pane below this packet table, you can select slices of the packet to highlight in the last pane where the packet is displayed.
- Just as in the TCP Flow output, everything under “Ready to start TLS” is unreadable. Again, if all you care about is the timing of packets or if you’re a relay that receives email in plaintext and then transmits the messages to Amazon SES, what we’ve discussed up to now will work just fine for your use case. You can still add logging in your application to print out the decrypted packets.
- The above screenshot shows just one conversation, but depending on your TCP Dump filtering expression, you can capture everything that’s going on to try and detect congestion or interference from other network traffic that your machine is dealing with.
A TCP Dump and Wireshark Example: TLS Wrapper
TLS wrapper mode encrypts everything right from the get-go, so your ability to peek into what’s happening is very limited. There is a way to get Wireshark to tell you which packets are used in the TLS negotiation, though. At a high level, the TLS setup process involves these steps:
- The client and server negotiate security capabilities to determine what to use.
- The server transmits digital certificates and public/private key information to the client so that the client can verify the identity of the server.
- The client exchanges public/private key information with the server (including a pre-master secret) and may send a digital certificate to show that the client is who it says it is (if the server asked for this).
- The server authenticates the client and then the client and server both turn the pre-master secret into master secrets that are used to generate the session key (the same key is generated independently on both sides). This session key is used to encrypt/decrypt communications from here on out.
If you’re deeply curious, you can read more in RFC 2246 (TLS 1.0), RFC 4346 (TLS 1.1), and RFC 5246 (TLS 1.2). Since both the client and server use a public/private key pair as part of this set-up process, you’ll need at least the client’s private key in order for Wireshark to understand the handshake. If you use Open SSL, you can generate and supply this pretty easily:
openssl genrsa -out ~/rsa_key.pem
openssl s_client -crlf -connect email-smtp.us-east-1.amazonaws.com:465 -key ~/rsa_key.pem
The first command line creates the key and the second command line is the one shown in the Amazon SES Developer Guide but with a private key supplied. With this connection set up, you can have your SMTP conversations and use the same TCP Dump command as before, only with port 465:
sudo tcpdump -i any -w ~/captures/capture_%Y-%m-%d-%H-%M-%S.cap -G 30 -n -X -Z $USER “port 465”
Then, just transfer the capture file and rsa_key file to your own computer and fire up Wireshark:
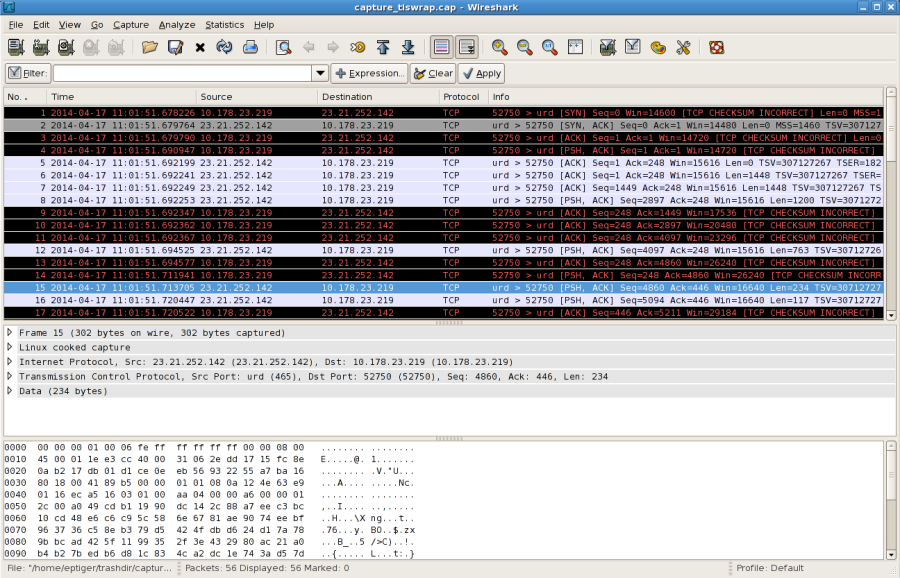
Note that all you see are SYNs and ACKs. We can fix this. Go to “Edit” -> “Preferences”, expand “Protocols” and then select “SSL”. For the above example, if the rsa_key file is in my home directory I’d put the following in “RSA keys list”:
23.21.252.142,465,smtp,/home/elton/rsa_key.pem
The first element is the server IP address (visible in the Wireshark GUI), the second element is the server port, the third element is the application protocol, and the last element is the location of the private key file. You’ll see something like this:
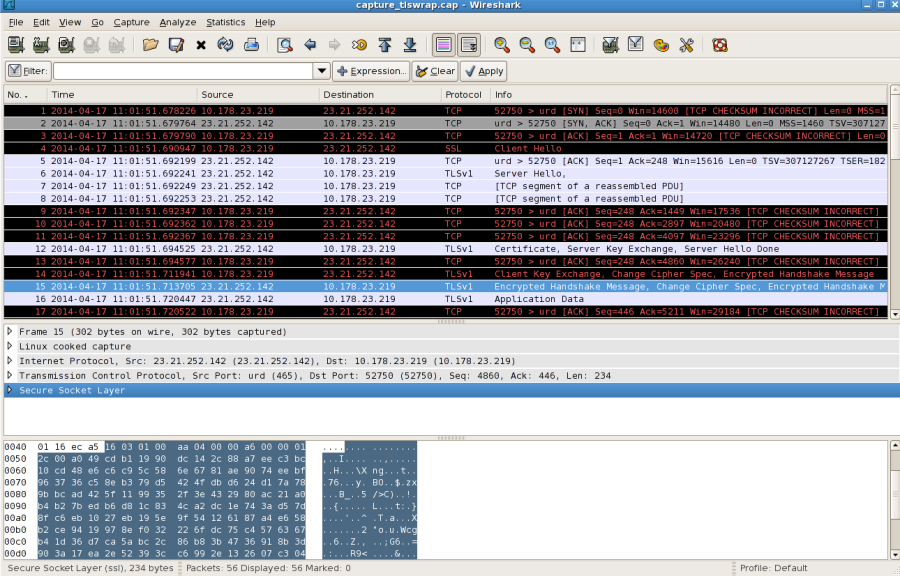
Now you’ll notice in the “Info” column that you can see more information at a high level and the protocol is specified in the previous column as TCP, SSL, or TLSv1 (whereas before it was just TCP). Additionally, the next pane with the packet breakdown has bits like “Secure Socket Layer” or whatever the protocol is that highlights the part of the packet involved. The “Application Data” rows are just encrypted SMTP messages. The real value though is being able to debug any TLS wrapper issues you may have by comparing good negotiations with bad ones or timestamps in good negotiations versus bad ones and getting to the bottom of whatever is going wrong.
We hope that these posts have given you a better understanding of what’s happening behind the scenes when you interact with Amazon SES, and empowered you to better debug problems that you may experience at the transport or network layer. Thanks for being an Amazon SES customer! Happy debugging!